July 2nd, 2025
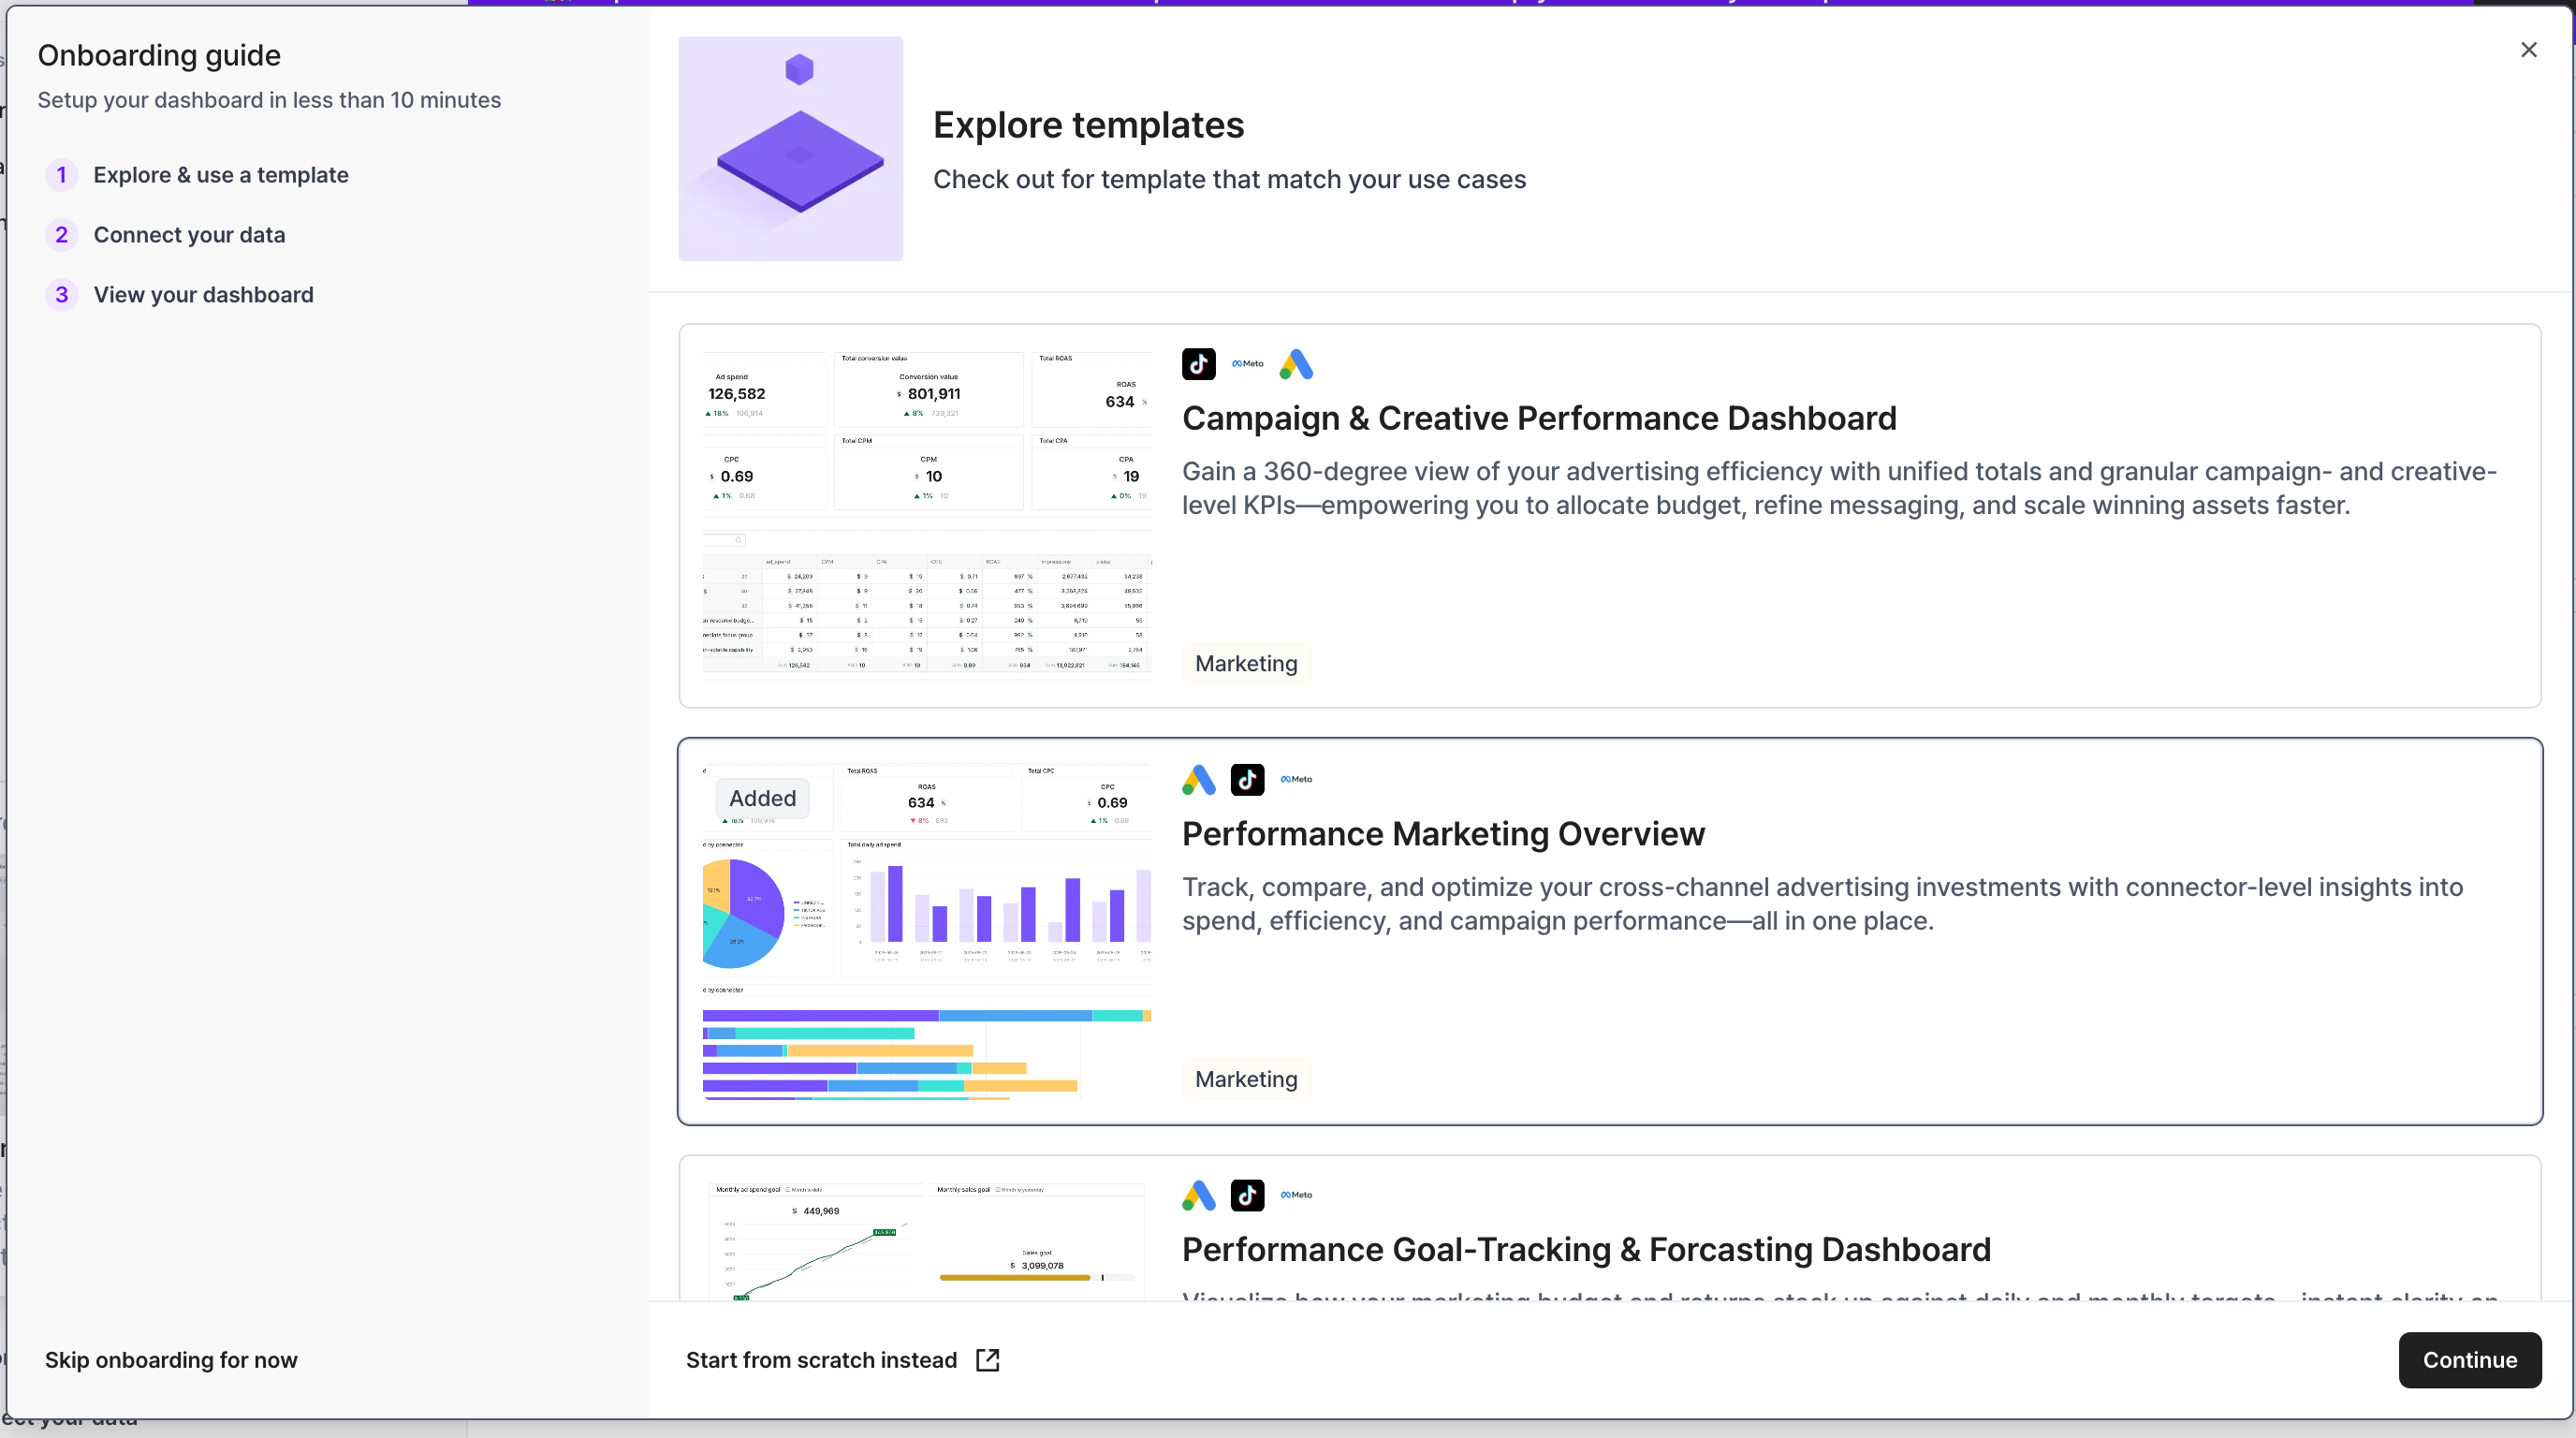
New to Endash? We’ve added a step-by-step guided onboarding to help you get started faster.
From creating your connection first dashboard to exploring data, we’ll walk you through it all.
June 29th, 2025
Fixed
Fixed an issue where
window_sumformulas didn’t display correctly in Table View.Fixed a bug where Dashboard Query Meter didn't refresh with updated data.
Fixed Bar Chart labels not showing when values were too small.
Fixed Time Series Table footer values not rounding properly.
June 27th, 2025
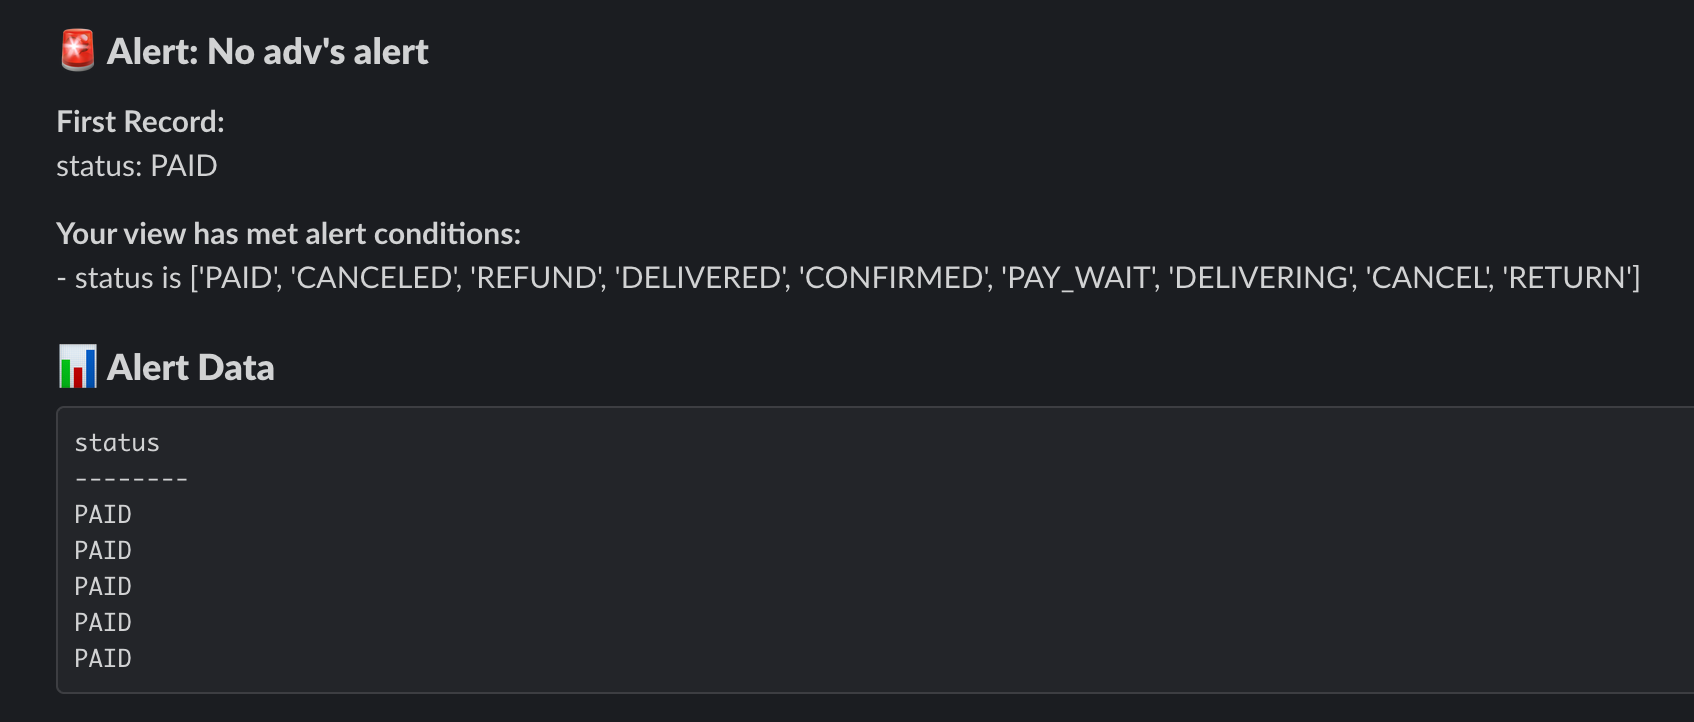
You can now set up a Slack webhook to receive alerts in your Slack channels.
June 17th, 2025
New
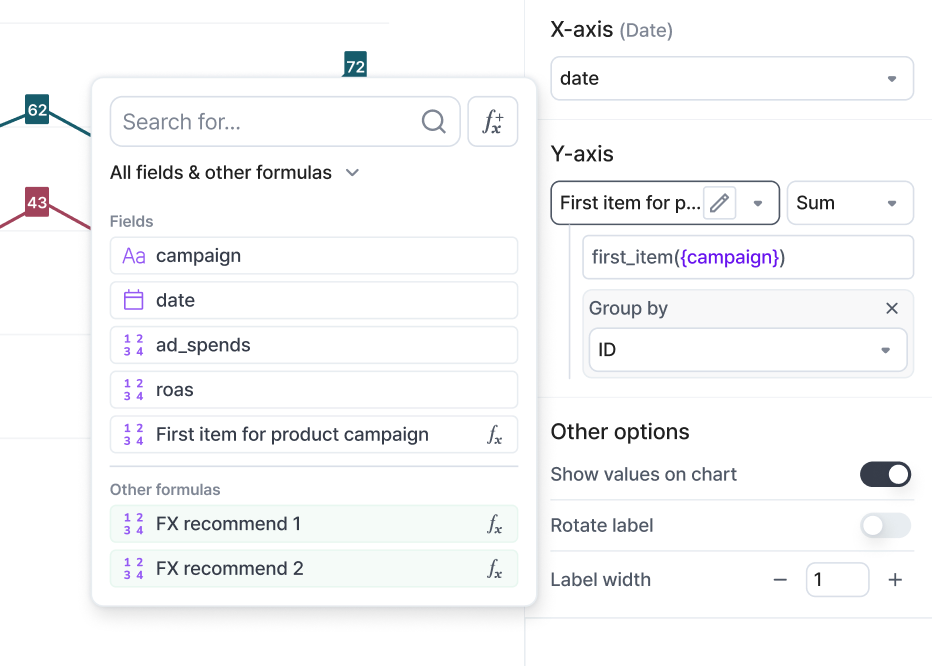
Tired of retyping the same formulas in every view? Now you don’t have to.
You’ll see recommended formulas from other views in the same data model — just hover to preview and click to copy them into your current view.
June 11th, 2025
New
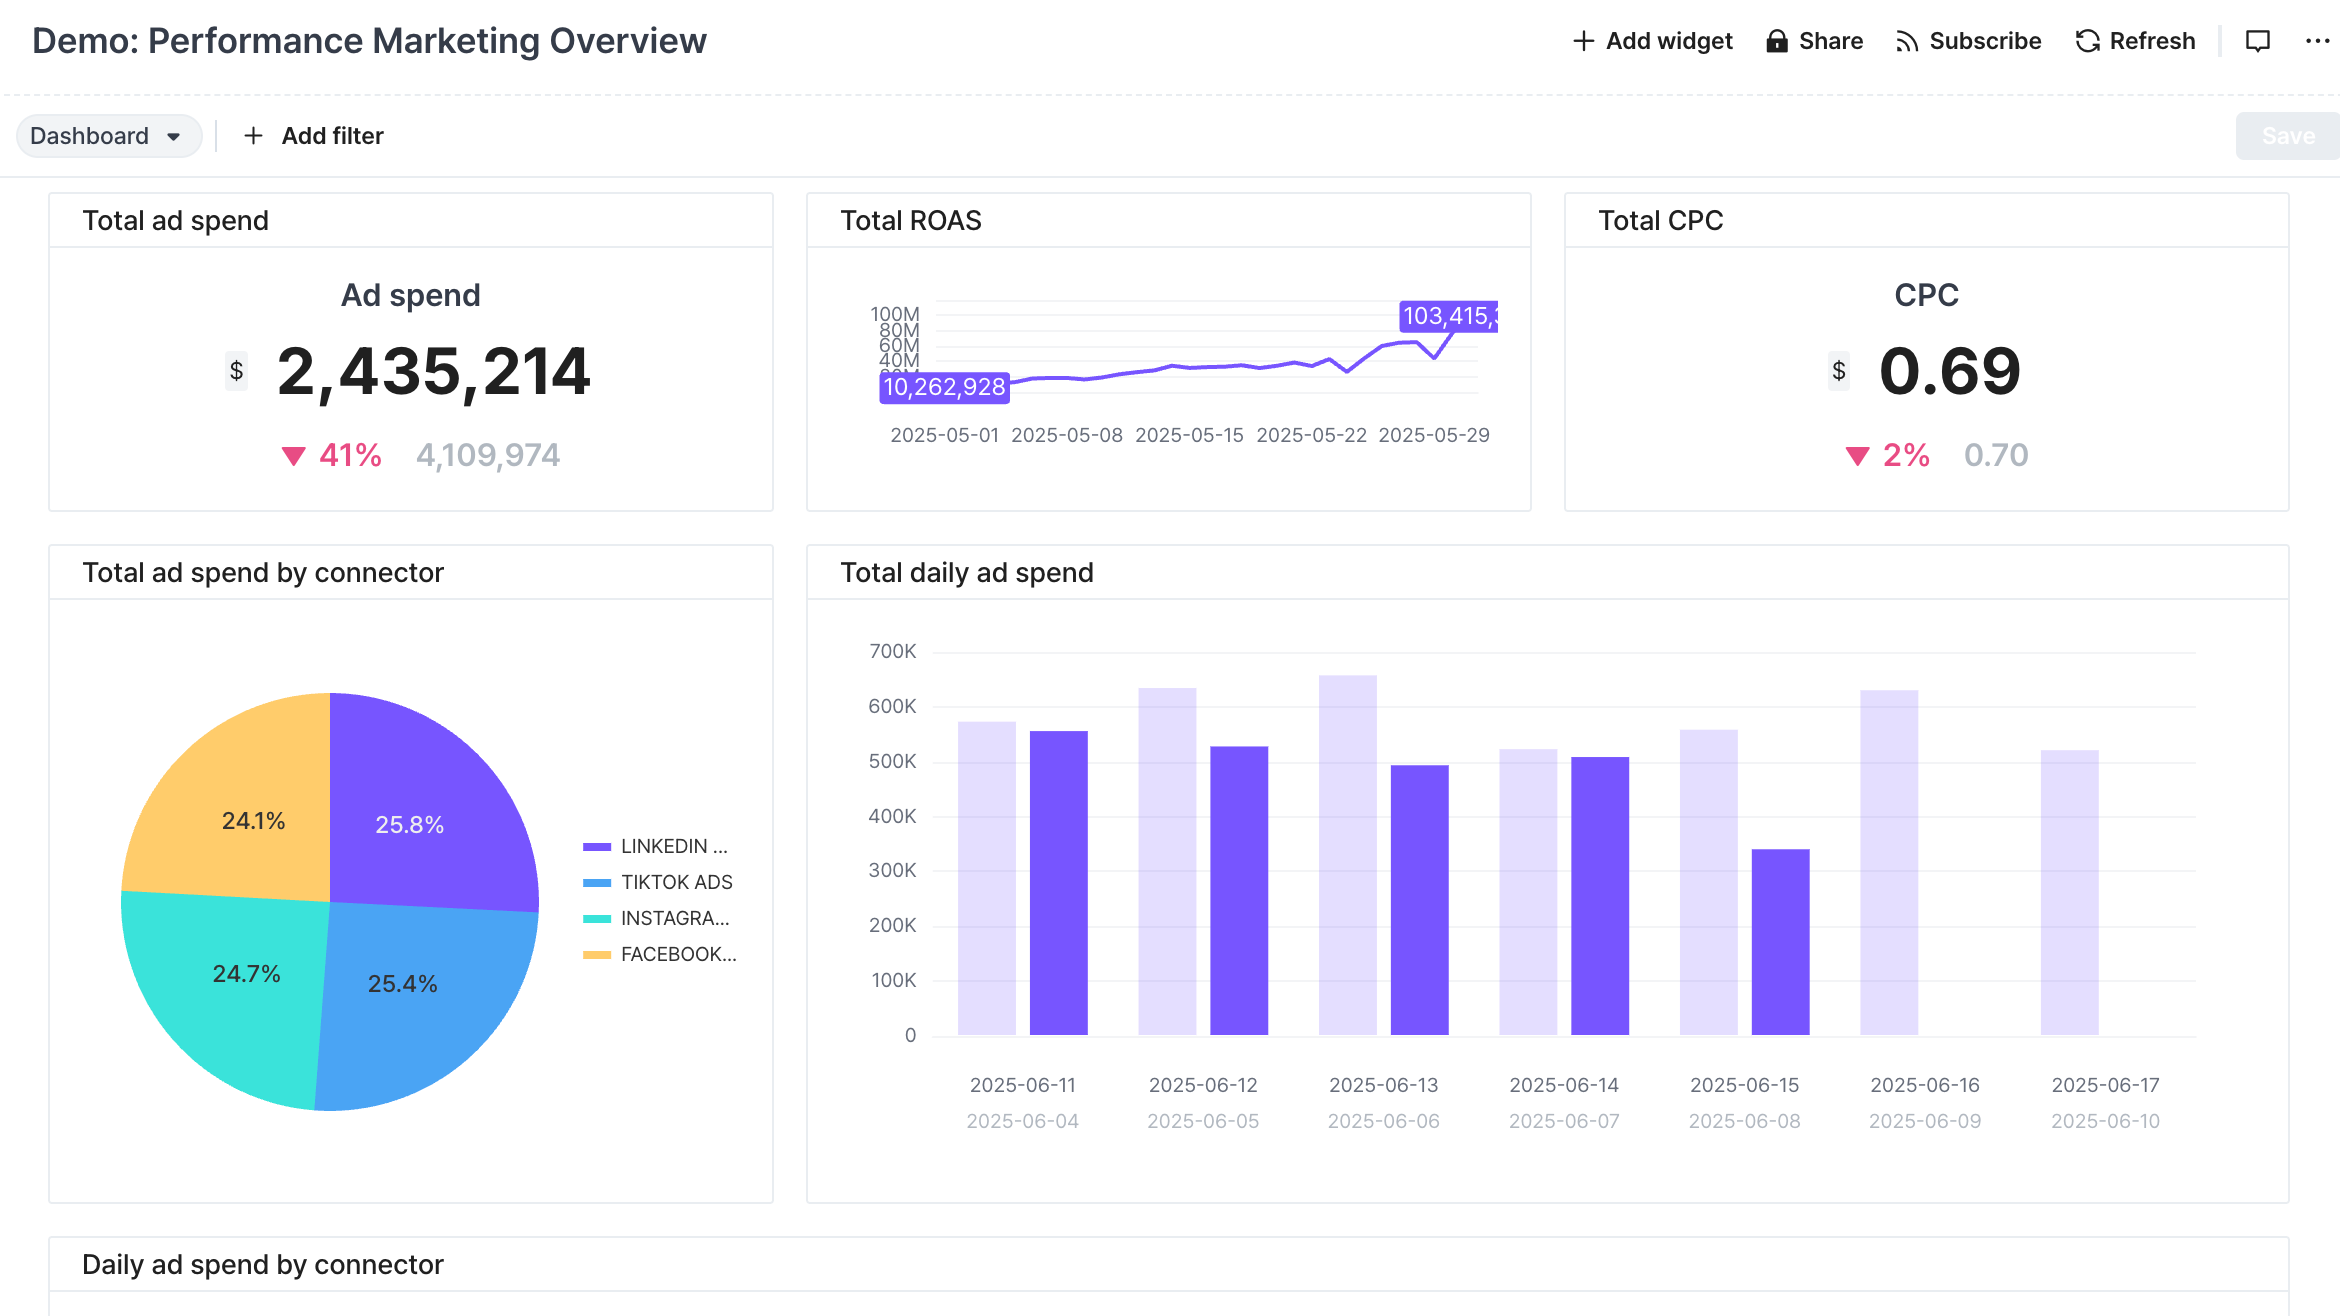
When you create a new team, we’ll automatically add demo dashboards and a data model — no setup or connection needed.
Start exploring right away and get a feel for how everything works!
May 7th, 2025
Improved
You can now choose to display only the top N largest items in your charts!
Perfect for charts with lots of data — just enter a number and focus on what matters most.
April 18th, 2025
New
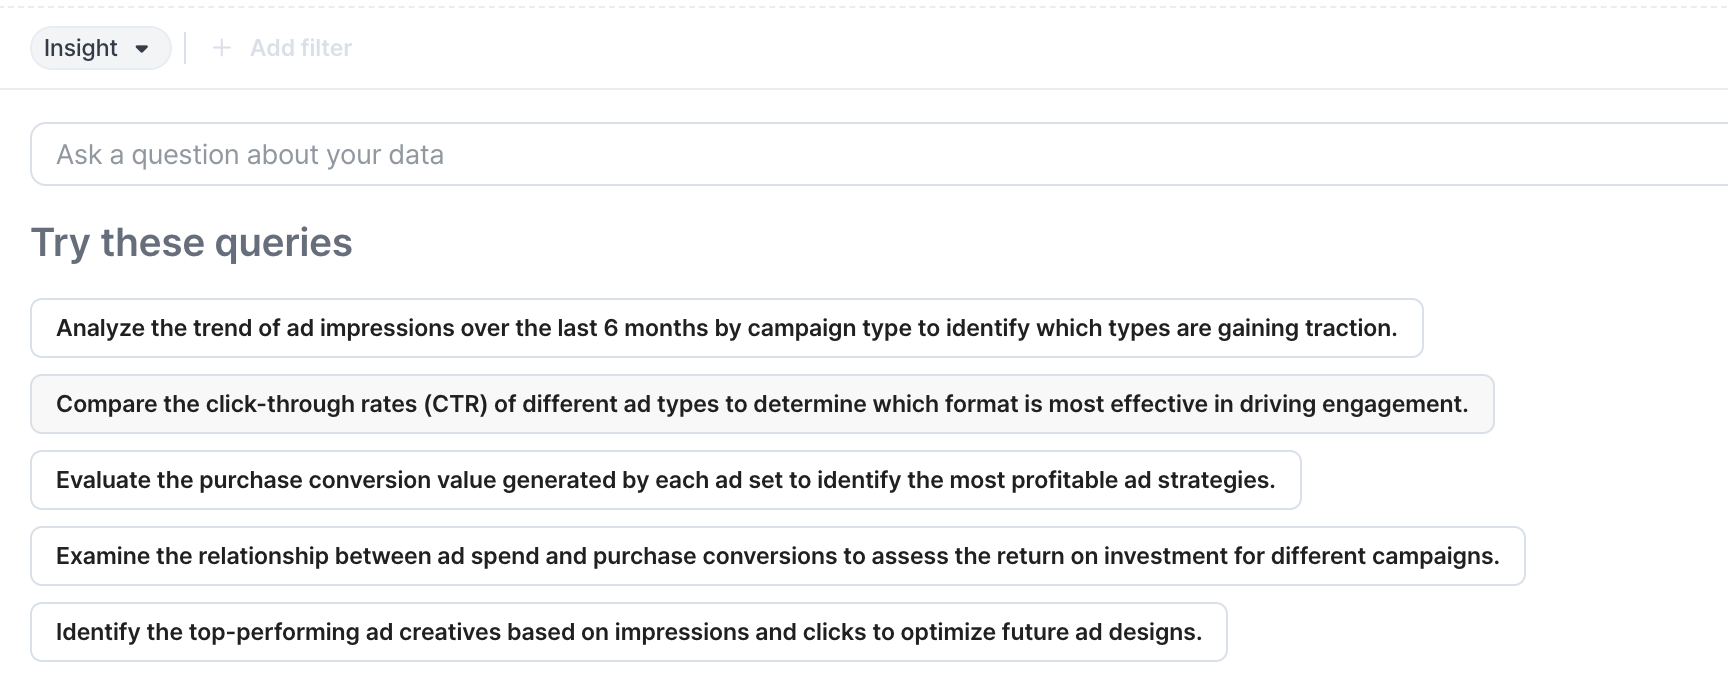
We’re excited to introduce the Insight tab — your new starting point for uncovering meaningful trends and patterns in your data.
With this feature, you can:
Explore suggested questions based on your data
Or ask your own question directly
Once you choose a question, we’ll automatically generate a relevant SQL query, followed by a data table, a chart, and a written explanation to help you understand the answer — all in one seamless view.
It’s never been easier to go from question to insight — no SQL skills required.